A Lighthouse score of 95 is satisfying. It's also possible to have a 95 on Lighthouse while your actual users — on budget Android phones, throttled home connections, with four browser extensions running — are seeing poor CLS and sluggish interactions. Lab tools and field data answer different questions, and you need both to close that gap.
Lab Data vs Field Data
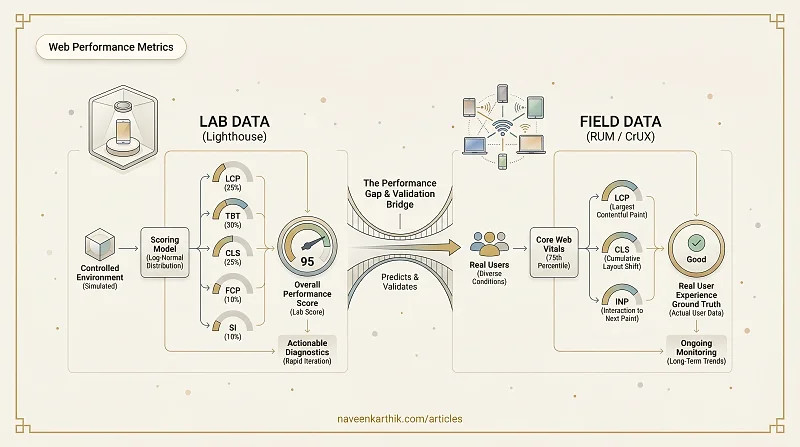
Lab data is collected in a controlled, reproducible environment. You run a tool against your URL, it simulates a device and network, and reports metrics. Lighthouse is the most widely used lab tool.
Field data (also called Real User Monitoring or RUM) is collected from actual browsers as real users navigate your site. It reflects the diversity of devices, networks, and geographies your users actually have.
| Lab | Field | |
|---|---|---|
| Reproducible | ✅ | ❌ |
| Reflects real users | ❌ | ✅ |
| Measures INP | ❌ | ✅ |
| Available before launch | ✅ | ❌ |
| Used by Google ranking | ❌ | ✅ |
How Lighthouse Works
Lighthouse is an automated auditing tool built into Chrome DevTools, available as a CLI, and the engine behind PageSpeed Insights.
The process:
- Lighthouse opens a controlled Chrome instance with a throttled CPU and network profile (simulating a mid-tier mobile device on a 4G connection by default).
- It loads the page from scratch and records a performance trace.
- It extracts raw metric values (LCP time, CLS score, TBT duration, etc.) from the trace.
- It maps each metric value to a score (0–100) using a log-normal distribution fitted to real-world CrUX data.
- It combines per-metric scores into an overall Performance score using fixed weights.
Current metric weights (as of Lighthouse 12):
| Metric | Weight |
|---|---|
| Largest Contentful Paint (LCP) | 25% |
| Total Blocking Time (TBT) | 30% |
| Cumulative Layout Shift (CLS) | 25% |
| First Contentful Paint (FCP) | 10% |
| Speed Index (SI) | 10% |
Total Blocking Time (TBT): The sum of all time the main thread was blocked for more than 50ms, measured between FCP and TTI (Time to Interactive). If a task runs for 80ms, 30ms of it is "blocking time" (80 − 50). TBT is Lighthouse's lab proxy for INP — a high TBT means the main thread is frequently busy, which means user interactions will queue up and feel sluggish. Speed Index (SI): A visual completeness metric — how quickly the page content visually fills in, measured by comparing video frames over time. Lower is better.
The Scoring Model
Each metric is scored on a curve, not a straight line. The curve is calibrated so that a "good" metric value maps to a score of 90:
| Metric | Good (score ≈ 90) | Poor (score ≈ 50) |
|---|---|---|
| LCP | ≤ 2.5s | ≥ 4.0s |
| TBT | ≤ 200ms | ≥ 600ms |
| CLS | ≤ 0.1 | ≥ 0.25 |
| FCP | ≤ 1.8s | ≥ 3.0s |
| SI | ≤ 3.4s | ≥ 5.8s |
The curve means marginal gains work differently at different levels: going from 4.0s to 3.5s LCP gives a big score jump; going from 2.0s to 1.5s gives a tiny one. The overall score is the weighted average of these individual metric scores — not a weighted average of the raw metric values.
In practice:
- 0–49 (red): At least one metric is severely poor. Priority fix needed.
- 50–89 (orange): Some metrics need improvement. Check the diagnostics.
- 90–100 (green): All metrics are near or within "good" thresholds. Hard to reach, harder to maintain.
Beyond the Score: Audits, Opportunities & Diagnostics
Lighthouse isn't just a number. Below the Performance score, you'll find:
- Opportunities — specific changes with estimated time savings (e.g., "Eliminate render-blocking resources — estimated savings: 0.8s"). These are your action items, ranked by impact.
- Diagnostics — additional information that doesn't directly estimate savings but provides context (e.g., "Avoids enormous network payloads," "Uses passive listeners").
- Passed audits — things you're already doing right. Don't skip these — they tell you what NOT to change.
Lighthouse Modes
Modern Lighthouse (v11+) has three modes accessible via DevTools or the CLI:
- Navigation — the default. Loads the page from scratch and measures everything from first byte to interactive. Use for page-load performance.
- Timespan — records a period of interaction. Click around, open modals, navigate within the SPA — Lighthouse measures performance during that window. Use for interaction analysis and INP estimation.
- Snapshot — captures the current state of the page without loading anything. Use for evaluating an already-loaded page's accessibility, best practices, and SEO.
For SPAs, Timespan mode is essential — a cold navigation doesn't capture what users actually do on your app.
Lighthouse's Limitations
Variability: Even in controlled conditions, Lighthouse scores vary run-to-run. CPU throttling is simulated in software and is sensitive to machine load. Run Lighthouse 3–5 times and use the median.
Simulated throttling ≠ real network: Lighthouse's default "Mobile" profile simulates a Moto G4 on a slow 4G connection using synthetic CPU and network throttling. This is an approximation. Real devices on real networks behave differently.
No real interaction: Lighthouse can't measure INP — it requires a user to actually interact with the page.
Single page load: Lighthouse measures a cold load. Returning visitors with warm caches, or users who have already loaded shared scripts, will have very different experiences.
Real User Monitoring (RUM)
RUM collects Core Web Vitals from real browsers using the browser's built-in Performance APIs:
The web-vitals library (by Google) wraps these APIs and handles edge cases.
What RUM tells you that Lighthouse can't:
- The 75th percentile experience across your actual user base
- INP — which interactions are slow and how often
- Performance breakdowns by device type, country, or connection type
- Whether a Lighthouse improvement actually helped real users
Free sources of field data:
- Chrome User Experience Report (CrUX): Aggregated data from Chrome users, available via PageSpeed Insights, Search Console, and the CrUX API.
- PageSpeed Insights: Shows both Lighthouse lab data and CrUX field data side by side.
Self-hosted RUM: Tools like Grafana + InfluxDB, or SaaS products like SpeedCurve, Calibre, or Datadog RUM, let you collect and analyse your own user data.
Using Both Together
The right workflow:
- Use Lighthouse for rapid iteration during development. It's fast, reproducible, and gives actionable diagnostics (not just scores).
- Use PageSpeed Insights (or CrUX) to validate that your improvements are moving field metrics for real users.
- Use RUM for ongoing monitoring. Set up alerts when CWV field scores degrade after a deploy.
Lighthouse score improvements that don't move field metrics aren't wasted — they often reflect real changes that just haven't accumulated enough data yet. But if weeks pass with no improvement in CrUX, you're likely optimizing something your real users don't hit. Field data is the ground truth.