JavaScript manages memory automatically — you allocate objects, the engine decides when to free them. Most of the time this works invisibly. When it doesn't, you get a memory leak: the heap grows steadily, GC pauses get longer, and the page eventually slows to a crawl or crashes the tab. Leaks in single-page applications are especially bad because the page never navigates away to reset state. A user on your SPA for an hour can accumulate what a server-rendered site would never hold.
How Garbage Collection Works
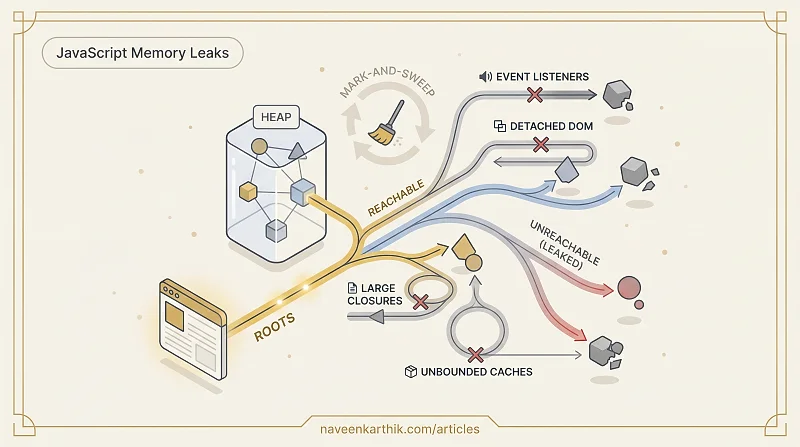
V8 uses a mark-and-sweep algorithm. It starts from a set of roots (global objects, the call stack) and marks every object reachable by following references. Anything not marked is unreachable — garbage — and its memory is reclaimed.
An object leaks when it remains reachable through a reference chain even though your application logic no longer needs it. The GC sees it as live and won't collect it.
The Four Common Leak Patterns
1. Forgotten Event Listeners
Adding a listener to a DOM element or global object keeps the listener's closure alive. If the closure references other objects, those leak too.
Always remove listeners when the component unmounts or the element is destroyed:
In React, clean up in the useEffect return function:
For Promise-based or fetch-based work, AbortController provides a standard cleanup pattern — it signals cancellation and lets the GC reclaim resources without waiting for the operation to finish. See Async #9 — AbortController for the full pattern.
2. Detached DOM Nodes
A node is "detached" when it's removed from the document but still referenced by a JavaScript variable. The GC can't collect it.
3. Closures Capturing Large Objects
A closure captures variables from its enclosing scope. If a long-lived callback captures a large object, that object stays alive for the lifetime of the callback.
4. Unbounded Caches
A Map or object used as a cache that grows without bound:
Use WeakMap for object-keyed caches (entries are automatically removed when the key is GC'd), set a maximum cache size, or implement an LRU eviction policy.
WeakRef and FinalizationRegistry
For more advanced use cases, WeakRef lets you hold a reference to an object without preventing GC, and FinalizationRegistry lets you run cleanup logic when an object is collected:
These are niche tools — don't reach for them before the simpler patterns above. But they're useful when you genuinely need to observe whether something has been collected.
Finding Leaks with DevTools
Heap Snapshot (Memory panel → Take snapshot): shows all objects on the heap grouped by constructor. Take two snapshots — before and after a user action — and compare them. Objects present in snapshot 2 but not 1 that you didn't expect are candidates.
Allocation Timeline (Memory panel → Record allocation timeline): shows a live bar chart of allocations. Blue bars that appear and stay blue (never GC'd) indicate held allocations.
Detached DOM tree filter: in the Heap Snapshot view, filter by "Detached" to find all DOM nodes removed from the document but still in memory.
GC Pauses
Garbage collection pauses execution while it runs. Major GC (full collection) is the most expensive. Modern V8 uses incremental and concurrent GC to spread the work across multiple smaller pauses, but the total GC time still shows up in the Performance panel as purple "Minor GC" and "Major GC" entries.
If GC entries appear frequently in your flame chart, you're allocating too many short-lived objects. Object pooling (reusing objects instead of allocating new ones) is the remedy for hot allocation paths.
The good news is that most leaks come from the same handful of patterns — forgotten listeners, detached nodes, capturing too much in closures. Fix those consistently and the heap snapshot comparison becomes a boring exercise. The DevTools Memory panel makes verification straightforward; the hard part is building the habit of cleaning up before the leak report lands in your inbox.