The usual loop for improving Lighthouse scores goes like this: you have an idea, you make a code change, you build, you deploy to staging, you run Lighthouse, you wait 30–60 seconds, you get a number. Then you realise the score fluctuated by 8 points from the previous run just due to network variance — so you run it again. And again. Then you're not sure if your change actually helped or if you're just seeing noise.
The Web Performance Planner moves the feedback loop out of production. You import a real Lighthouse report and the tool simulates Core Web Vitals scores in real time. Change a loading strategy, the score updates instantly. Defer a script, reduce TTFB, enable a CDN — every change produces a deterministic, comparable result. No deployments. No waiting. No variance.
Open the Web Performance Planner →
Why This Changes How You Work
Without a simulator, every experiment requires a full code → build → deploy → measure cycle. You can't safely answer questions like "does deferring this script matter more than reducing its size?" without building two separate versions and running Lighthouse on both — multiple times each, because of variance.
With the planner, that question takes about 30 seconds. Create two variations, change one thing in each, compare side by side. The numbers are deterministic — the same input always produces the same output — so differences between variations are real, not noise.
This also changes how you plan work. Before writing a single line of code, you can model your target architecture and see what score it will produce. The planner becomes a constraint-checking tool that catches performance problems at the design stage instead of the post-deploy stage.
Start with a Lighthouse Report
The planner starts from a real Lighthouse JSON report. When you import one, the tool extracts every resource from your page — sizes, loading strategies, JavaScript execution times, measured network timings — and fits its simulation curves so the overall score matches your real score exactly. From that point, every what-if change is a calibrated prediction based on your actual page.
To get your Lighthouse JSON: Open Chrome DevTools, go to the Lighthouse tab, run an analysis, click the download icon and choose "Save as JSON".
To import it: Click "Calibrate from Lighthouse" on the welcome screen, upload the file, review the preview, then click "Create page". You can recalibrate at any time without losing your variations.
Pages and Variations
A page is one URL you're modelling — your homepage, product page, checkout flow. Each page has its own calibration and saved variations.
A variation is a named configuration within a page. Every page starts with a baseline variation — your current real-world state. From there you create variations to explore hypothetical changes. Each variation is a full independent snapshot: its own resource list, TTFB setting, and CDN state. Creating a new variation clones the baseline so you always start from a known reference point.
The variation tabs each show a mobile score badge. You can see at a glance which configuration scores best. Clicking a tab instantly updates the entire dashboard to reflect that variation's numbers.
The Dashboard
The right side of the screen shows the performance dashboard, with a toggle for Mobile and Desktop profiles. The mobile score is almost always lower — it simulates a throttled slow-4G connection (150ms RTT, 200 KB/s bandwidth, 4× CPU slowdown). Desktop simulates a cable connection (40ms RTT, 1,250 KB/s).
The score card shows the overall 0–100 performance score and five metric rows (TBT, LCP, CLS, FCP, SI), each with a colour-coded sub-score, delta pill against the baseline, and contribution to the overall. The colour coding follows Lighthouse conventions: green (≥90), orange (≥50), red (<50).
Each score card also contains a resource waterfall — a timeline showing every file your page loads as a horizontal bar, broken into the same timing phases Chrome DevTools shows (DNS, TCP, SSL, request, waiting/TTFB, download). Two vertical markers show where FCP and LCP fall across your resource timeline. When imported from Lighthouse, the waterfall uses your actual measured timings.
Drop a file's size or remove it entirely and the waterfall rebuilds instantly — every bar shifts, connection pools adjust, and all five metric scores recalculate. No re-import. No re-measure. One change, immediate feedback.
Comparison Mode
Once you have two or more variations, switch to Comparison Mode. Select up to four variations and they appear side by side, each showing all five metric scores and the overall. The best value per metric is highlighted green, the worst red. Comparison mode always uses the mobile profile.
Page Meta Controls
Two controls affect the whole page simulation:
TTFB is your server's response time in milliseconds. Everything else on the page waits for this. Aim to keep it under 200ms.
CDN is a toggle that simulates having your static assets served from an edge node. Enabling it reduces the effective round-trip time for same-origin resources by about 60%.
Settings
The settings panel (gear icon) lets you tune the simulation model — network profiles (RTT, bandwidth, CPU multiplier), scoring weights and curves, and HTTP connection model parameters. Settings can be exported as JSON and shared with teammates so everyone runs the same assumptions.
Sharing and Persistence
Everything saves automatically to IndexedDB as you work — no account, no server, no save button. Nothing leaves your machine. To share your work, export any page as a .json file. Anyone can import it and see the same pages, variations, calibration, and scores.
A Real Example
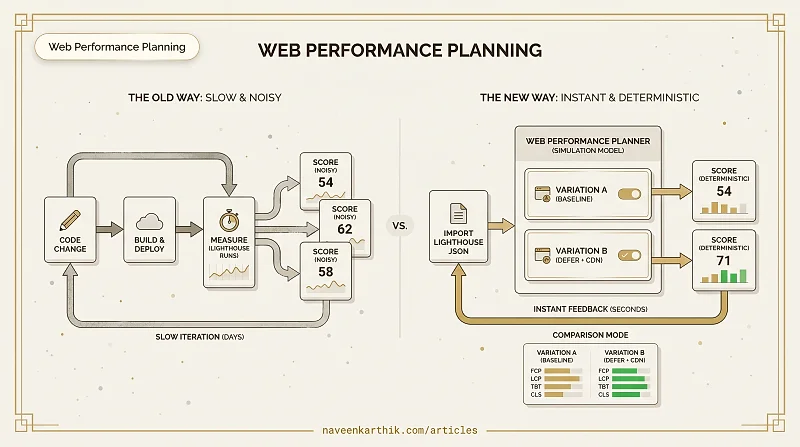
Imagine your homepage scores 54 on mobile Lighthouse. The team is aiming for 70. Here's what the planner workflow looks like:
You import your Lighthouse JSON. The simulated score lands at 54, matching your real number. The waterfall shows a large third-party analytics script loading as render-blocking, pushing FCP to 4.3 seconds and TBT to 680ms.
You create a variation called "defer analytics", change the script's loading to defer. Score jumps to 65. You create another variation called "defer + CDN", enable CDN, drop TTFB to 80ms. Score reaches 71.
You switch to Comparison Mode. The baseline is at 54, "defer analytics" is at 65, "defer + CDN" is at 71. FCP dropped from 4.3s to 2.1s, TBT dropped from 680ms to 290ms.
That whole process took about 10 minutes and involved zero code changes. What would have taken a week of incremental deploys and noisy Lighthouse runs became a planning session.