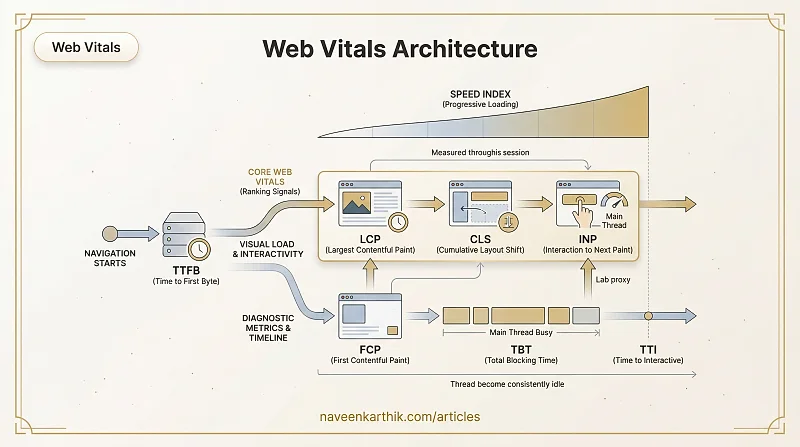
Three numbers sit at the top of Google's ranking signal: LCP, CLS, INP. But web performance has a broader vocabulary — TTFB, FCP, TBT, TTI, Speed Index, FID. This article maps all of them: what each one measures, where it lives in the loading timeline, how they connect to each other, and which ones actually move rankings.
The Two Tiers
Google's Web Vitals programme divides metrics into two tiers:
- Core Web Vitals (CWV) — LCP, CLS, INP. These are Google's ranking signals. A "passing" site needs "Good" scores at the 75th percentile of field data for all three.
- Other Web Vitals — TTFB, FCP, TBT, TTI, Speed Index. Diagnostic metrics — not ranking signals, but essential for understanding why your Core Web Vitals scores are what they are.
Core Web Vitals
Largest Contentful Paint (LCP)
What it measures: The render time of the largest visible content element — typically a hero image, a large text block, or a video poster. It marks the point when the user perceives the main content as loaded.
Threshold:
| Score | Value |
|---|---|
| Good | ≤ 2.5s |
| Needs improvement | 2.5s – 4s |
| Poor | > 4s |
LCP is dynamic — the "largest" element can change during page load. The browser might first paint a large <h1> as the LCP candidate, then a hero image finishes loading and becomes the new (final) LCP element. The LCP score is always the time of the final candidate, so a late-loading hero image pushes your LCP out.
Elements considered for LCP:
<img>elements<image>inside<svg><video>poster images- Elements with
background-image: url()(not CSS gradients) - Block-level text nodes (headings, paragraphs)
What degrades LCP:
- Slow server response (high TTFB)
- Render-blocking CSS or JavaScript delaying paint
- LCP image not preloaded or accidentally lazy-loaded
- Images served without
width/height(causing layout recalculations)
How to improve LCP:
Other high-impact fixes: serve images in WebP/AVIF, reduce TTFB by serving from a CDN, and eliminate render-blocking resources from the critical path.
Cumulative Layout Shift (CLS)
What it measures: The sum of all unexpected layout shift scores during the page's lifespan. A layout shift occurs when a visible element changes its position on screen without user input.
Threshold:
| Score | Value |
|---|---|
| Good | ≤ 0.1 |
| Needs improvement | 0.1 – 0.25 |
| Poor | > 0.25 |
The score is calculated per shift event as: impact fraction × distance fraction.
- Impact fraction — what percentage of the viewport area was affected by the shift?
- Distance fraction — how far did the element move relative to the viewport height?
CLS is measured from navigation until page unload — a layout shift from a late-loading ad, cookie banner, or toast notification 30 seconds after load counts just as much as one during the initial paint.
Common causes of CLS:
- Images without
widthandheightattributes — browser can't reserve space before the image loads - Ads, embeds, or iframes without reserved dimensions
- Web fonts causing text to reflow when they load (FOUT) — see Font Optimization
- Dynamically injected content above existing content (banners, cookie notices)
- Animations that change layout properties instead of using
transform
How to improve CLS:
For font-induced layout shift, font-display: swap with a well-matched system font fallback is the best balance for content sites. For ads and embeds, reserve space with a fixed min-height on the container.
Interaction to Next Paint (INP)
What it measures: The latency of the worst interaction (click, tap, or keypress) during a page session — specifically, the time from when the user interacts to when the browser produces the next visual update in response.
INP replaced First Input Delay (FID) as a Core Web Vital in March 2024. FID only measured the first interaction and only the queueing delay before processing; INP measures all interactions end-to-end (queueing + processing + rendering).
Threshold:
| Score | Value |
|---|---|
| Good | ≤ 200ms |
| Needs improvement | 200ms – 500ms |
| Poor | > 500ms |
What makes INP high:
- Long tasks on the main thread blocking response to input
- Heavy JavaScript execution in event handlers
- Complex DOM updates triggered by interaction
How to improve INP:
INP in the field ≈ TBT in the lab. Since you can't simulate real user interactions in Lighthouse, look at Total Blocking Time (TBT) as your lab-side proxy. A high TBT means the main thread is busy, which means interactions will queue up and feel slow. Reducing long tasks improves both.
Other Web Vitals — Diagnostic Metrics
These are not ranking signals, but they explain why Core Web Vitals fail. Think of them as the layer beneath.
TTFB — Time to First Byte
What it measures: Everything between sending a request and receiving the first byte of the response: DNS lookup, TCP connection, TLS handshake, and server processing time.
Target: < 800ms
Why it matters: TTFB is the gate every other metric waits behind. A 500ms TTFB pushes LCP, FCP, and TBT out by the same amount regardless of any client-side optimisation. It's almost entirely a server/network problem — slow database queries, no CDN, cold serverless starts, or missing HTTP/2.
See What is TTFB? for a full breakdown.
FCP — First Contentful Paint
What it measures: The time at which the browser first renders any content — text, image, SVG, or non-white canvas. It's the first visual signal that the page is alive.
Threshold:
| Score | Value |
|---|---|
| Good | ≤ 1.8s |
| Needs improvement | 1.8s – 3s |
| Poor | > 3s |
FCP ≤ LCP always — FCP fires when the first thing appears; LCP fires when the largest thing appears. A large gap between the two usually means the main content (a hero image) is being discovered and downloaded well after the initial paint — a sign you need to preload it.
See What is FCP? for a full breakdown.
TBT — Total Blocking Time
What it measures: The sum of the "blocking portion" of every long task between FCP and TTI. A task is "blocking" if it exceeds 50ms — TBT counts the milliseconds above 50ms for each one.
Long task A: 250ms  →  blocking portion = 250 - 50 = 200ms
Long task B:  80ms  →  blocking portion =  80 - 50 =  30ms
                                          TBT = 230ms
Threshold:
| Score | Value |
|---|---|
| Good | ≤ 200ms |
| Needs improvement | 200ms – 600ms |
| Poor | > 600ms |
TBT is lab-only — you can't measure it from real user sessions because it requires the full task timeline. It's the primary lab-side proxy for INP: reduce TBT and you almost always reduce INP.
How to reduce TBT:
- Break long tasks with
scheduler.yield()orsetTimeout(..., 0) - Defer non-critical JavaScript (
defer,async, or load-on-interaction) - Move heavy computation to Web Workers
- Reduce hydration cost in SSR apps with streaming or selective hydration
TTI — Time to Interactive
What it measures: The earliest point at which the page is both visually usable and reliably interactive — specifically, the first 5-second window after FCP where no long task takes more than 50ms and the network is quiet (≤ 2 in-flight requests).
Target: < 3.8s (lab data)
Why it matters: TTI exposes apps that look loaded but aren't. A React app that renders a shell immediately but blocks the thread during hydration will have a low LCP but a high TTI — the gap between the two is the "uncanny valley" where users click buttons and nothing happens.
TTI has been de-emphasised by Google since INP was introduced, but it remains useful for diagnosing hydration-heavy SPA pages.
Speed Index (SI)
What it measures: How quickly content is visually populated during page load — not just when it finishes, but how progressively it fills in. It's computed by analysing video frames of the loading process.
Threshold:
| Score | Value |
|---|---|
| Good | ≤ 3.4s |
| Needs improvement | 3.4s – 5.8s |
| Poor | > 5.8s |
A page that holds a blank white screen until everything is ready will have a high Speed Index even if its LCP is acceptable. SI rewards progressive rendering — content that fills in steadily rather than appearing all at once.
How to improve SI:
- Inline critical CSS so above-the-fold content paints first
- Eliminate render-blocking resources from
<head> - Prioritise above-the-fold content in SSR output
- Use skeleton screens or progressive image loading (blur-up)
FID — First Input Delay (Deprecated)
Historical context: FID was a Core Web Vital from 2020 until March 2024. It measured only the queueing delay before the browser began processing the first user interaction — not the time to actually paint a response.
Why it was replaced: FID had two key weaknesses — it only measured the first interaction, and it only measured the queueing delay (not the total processing + rendering time). INP fixes both.
If you see FID in older audits or dashboards, treat it as a rough signal for main-thread contention during initial load. The fixes are identical to INP.
How the Metrics Relate
Navigation starts
│
├─ [TTFB] ─────── server response time (the gate)
│
├─ [FCP] ──────── first anything painted
│    │
│    ├─ [LCP] ─── largest element painted        ┐
│    ├─ [CLS] ─── layout shifts (whole session)  ├─ Core Web Vitals
│    └─ [INP] ─── worst interaction (field only) ┘
│
├─ [TBT] ──────── lab proxy for INP (FCP → TTI)
├─ [TTI] ──────── first 5s quiet window
└─ [SI] ───────── progressive fill score
The cascade in practice:
- High TTFB → everything else is late
- High TBT → high INP (main thread is too busy to respond)
- Missing image dimensions → high CLS
- Late-discovered hero image → high LCP (and large LCP–FCP gap)
Field Data vs Lab Data
| Metric | Field (RUM) | Lab (Lighthouse) |
|---|---|---|
| LCP | ✅ | ✅ |
| CLS | ✅ | ✅ |
| INP | ✅ only | ❌ use TBT |
| TTFB | ✅ | ✅ |
| FCP | ✅ | ✅ |
| TBT | ❌ use INP | ✅ only |
| TTI | ❌ | ✅ |
| Speed Index | ❌ | ✅ |
Field data (CrUX, PageSpeed Insights, Search Console) is what Google uses for ranking. Lab data (Lighthouse, WebPageTest) is for diagnosis and local iteration.
The critical rule: a site must pass CWV thresholds at the 75th percentile of field data to receive the ranking signal. Lab scores don't count for ranking — they count for debugging.
Prioritising Fixes
| Priority | Metric | If it's bad… |
|---|---|---|
| 1 | TTFB | Add CDN, fix server response time, enable HTTP/2 |
| 2 | LCP | Preload hero image, serve WebP/AVIF, avoid lazy-loading it |
| 3 | CLS | Add explicit image dimensions, reserve space for ads and fonts |
| 4 | TBT / INP | Break up long tasks, defer non-critical JS, use Web Workers |
| 5 | FCP | Inline critical CSS, remove render-blocking resources |
| 6 | TTI / SI | Code-split, reduce JS parse cost, defer hydration |
Start with TTFB — it's a multiplier. A 500ms improvement in TTFB improves LCP, FCP, and TBT simultaneously without touching a single line of front-end code.
Where to Go Next
- Performance #9 — Lighthouse & Real User Monitoring — how to measure all of these metrics in practice
- Performance #10 — Resource Loading Strategies — fixing LCP and FCP at the loading layer
- Performance #11 — Image Optimization — the most common LCP fix in detail
- What is TTFB? — the metric that sets the floor for everything else
- What is FCP? — the first visual signal your page is alive
- What are Long Tasks? — the root cause of high TBT and INP